
Auto-smoothing
What is Auto-smoothing?
Auto-smoothing uses advanced statistical regressions to automatically fill gaps, correct irregularities, and remove outliers in your survey data to create base pay benchmarks that best reflect your survey data. Instead of manually applying fallbacks or spending weeks filling data gaps, Auto-smoothing uses regression analysis and intelligent data generation to maximize both coverage and relevance of your market data.
Problems it solves:
- Time-consuming manual processes: What previously took 2+ weeks of manual gap-filling now takes seconds
- Maximizing coverage reduces relevance: Eliminates the need to use less relevant fallback surveys to achieve coverage
- Inconsistent progressions: Automatically identifies and corrects irregular level progressions and removes statistical outliers
Key features
Calculated Data Generation & Weighting
Auto-smoothing generates additional calculated data points using geo-differentials to supplement your original survey data. This provides more data points for regression analysis while heavily weighting your original mapped survey data (4:1 ratio). There are two ways to set these up before you run auto-smoothing:
-
Pave calculates geo differentials from your survey data
- Calculate geo-differentials using the provided survey data, identifying an “anchor” pay zone.
- A single geo-differential multiplier is calculated between the primary and relative pay zone, based on the survey data
- For example - Pave identifies that the US is the primary pay zone and NZ is the relative pay zone. The geodiff point for SWE P4 in New Zealand = (SWE P4 in the US) x (US : NZ multiplier defined from the survey data)
-
Customer defined pay zone differentials (set up in Pay Zones in the band set)
-
Calculate geo differentials using your defined pay zone differentials defined in the Pay zone tab
-
For example - customers define the US as the primary pay zone and New Zealand as 60% of the US
- The geo diff point for SWE P4 in New Zealand = (SWE P4 in the US) x (.60, the customer defined geo diff)
-
Intelligent Outlier Removal
Built-in statistical outlier removal fits an initial simple linear model, then calculates the median predicted y-value from that model, flags points that deviate more than 50% from that median predicted value, and runs the final regression excluding those outliers, preventing bad data points from skewing results.
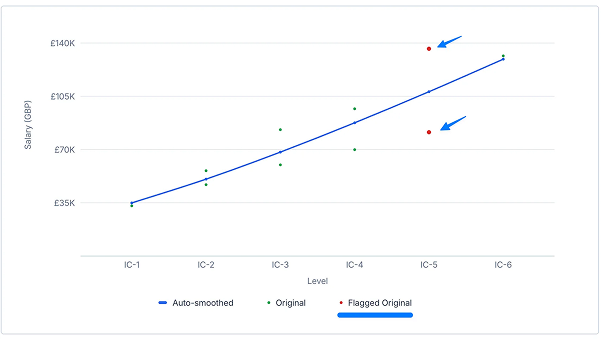
Example Use Case:
If a particular survey slice shows a Software Engineering P4 benchmark of $200K when all other data points suggest it should be around $120K, Auto-smoothing will flag and exclude this outlier from the final calculation.
Advanced Regression Modeling
Auto-smoothing fits multiple regression models (linear and non-linear) to identify the best statistical fit for your data, not including the outliers to create a smooth progressions that accurately represent market patterns while preserving the characteristics of your original survey data. Data points that are weighted more based on the weighting set up (manual, employee, company) on the Data Rules step will contribute more to the regression, as will original data points are weighted 4:1 to over calculated data.Example Use Case: For a ladder with irregular progression where P3 appears higher than P4, the system will fit the optimal regression line through all available data points, creating logical progression that maintains the overall market pattern while correcting the irregularity.
Confidence Scoring & Transparency
Every auto-smoothed ladder receives a color-coded confidence score (Green: >0.9 R², Yellow: >0.6 R², Red: <0.6 R²) with full visibility into the methodology, original vs. calculated data points, and regression analysis used and recommended actions. For yellow and red ladders, we recommend reviewing and gathering additional data where relevant or applying a manual edit.
Additional Features:
Flexible Editing Capabilities
In the sidepeek, you can revert individual auto-smoothed bands, update weights or add a manual composite in the sidepeek and re-autosmooth the ladder to incorporate those edited benchmarks, with the system maintaining clear audit trails of all changes.
Geo differential and level progression manual edits cannot be combined with Auto-smoothing - applying one will revert the other. However, job code edits will revert Auto-smoothing, but you can reapply Auto-smoothing after making these edits to incorporate the new data.
Visuals and Activity Log
Each auto-smoothed ladder includes interactive charts and details on the auto-smoothed vs. original data, as well as more detail on the specific survey benchmarks in the “Original” tab. You can see a history of your changes in the activity log.
Best Practices
-
Use track to delineate which jobs should be part of the same progression: Auto-smoothing will only smooth within a track, so it's important to use the track concept correctly. For example, if you expect the top of your IC track to overlap with the bottom of your M track, then you would want to make sure that these are separate. Similarly, if you expect a smooth progression between the highest level in the P track and the lowest level of M track, then you might want to consider consolidating into a single L track so auto-smoothing can take advantage.
-
Ensure all levels exist in job architecture and are mapped to market data, even if there aren't employees in the job: To maximize the benefits of Auto-smoothing, build out complete ladders with no gaps in the levels per ladder and all levels mapped to market data. It requires at least 2-3 levels with data to fit a line and without sufficient levels mapped, auto-smoothing lacks the data points needed for meaningful regression.
-
Map as much data as possible to your pay zones: When calculating additional data using “Pave calculates geo differentials from your survey data,” the system needs data in both pay zones to calculate the differential.
- Note: Regardless of whether a customer uses their own geo differentials or the ones from your survey data, customers should avoid mapping surveys to identical pay zones— eg US Zone 1 / 2 / 3. This results in the geo differential data being the same as the original data creating skewed results. Auto-smoothing will take care of this for the customer.
-
Weighting: Check that your weighting in the Data Rules section is step is up to date, as the auto-smoothing algorithm will incorporate weighting into the regression. For example, if you're using employee or company weighting the benchmark slices with larger sample size will contribute more.
-
Filters: Using the smoothing status, you can filter down to just auto-smoothed yellow or red confidence ladders to focus your review time on the results that need additional attention, while trusting the Green results to move forward without manual review.
FAQs
How is survey weighting incorporated into the model? Bubble sizes will represent the relative weighting/sample sizes of different data points. The system uses your configured market weighting (manual, employee or company-based) and heavily weights the original data over any geo differential calculated data in the regression analysis.
When selecting geo differentials from survey data, how are the geo differentials calculated?
- Primary pay zone: Pave picks the pay zone with the most jobs that have at least one mapped survey slice and a weighting above zero. That zone becomes your primary pay zone, and every other zone is a target pay zone.
- Compare each job across zones. For every job that has data in both your primary pay zone and a target zone, Pave checks how the target zone's value compares to the primary zone's. If a P1 Software Engineer in the UK comes out at 70% of the same job in the US, that job's result is 0.70. Pave repeats this for each job with data in both zones.
- Combine into one multiplier. Pave takes the middle value (the median) of those job-level results. For example, results of 0.70, 0.85, and 0.90 give a multiplier of 0.85. Pave then applies that 0.85 to your US data to generate calculated UK data. Using the median keeps one unusual job from pulling the result up or down.
- Reliability checks: A target pay zone geo diff calculated data is only used if at least 3 jobs can be compared between the two zones, and the ratios are consistent with each other. If a zone fails either check, Pave does not generate calculated data for that entire pay zone, and the auto-smoothed results use your original survey data only.
Can I use Auto-smoothing with fallbacks? Auto-smoothing is designed to maximize the coverage of your primary survey data. We recommend removing fallbacks before applying auto-smoothing, so the results reflect your most relevant data, while not skewing the results with less relevant fallback data.
How is this better from a regular regression?
- More data points: Auto-smoothing creates calculated data points using geo differentials, turning a ladder with 2 original data points into one with potentially 8-10 points for regression analysis.
- Intelligent weighting: Original survey data is weighted 4:1 compared to calculated data, ensuring your actual market data drives the results while calculated data just provides additional signal. Additionally, the regression considers how you've weighted your surveys. E.g. If you've used manual weighting and heavily weighted one survey over the other, the regression will weight those data points more.
- Outlier detection: Built-in statistical outlier removal fits an initial simple linear model, then calculates the median predicted y-value from that model, flags points that deviate more than 50% from that median predicted value, and runs the final regression excluding those flagged outliers, preventing bad data points from skewing results.
- Contextual relationships: Leverages patterns learned across your entire job architecture (geographic patterns) rather than analyzing each ladder in isolation.
- Dynamic model selection tailored to your data: Auto-smoothing tests both linear and non-linear models, choosing the best statistical fit to optimally balance bias and variance.
A typical regression on sparse compensation data would either fail entirely or produce unreliable results due to insufficient data points. Auto-smoothing solves this by intelligently expanding the dataset while preserving the integrity of your original survey data.
How should I think about combining auto-smoothing with manual level progression edits?
- If you apply auto-smoothing to a ladder with a level progression edit, it overwrites the progression. This is so that you don't auto-smooth over manipulated data.
- If you apply a level progression edit to an auto-smoothed ladder, it overwrites the auto-smoothing, so you don't manipulate the auto-smoothed data.
- Recommendation is to apply auto-smoothing first, revert per level or full ladder if the results don't look right, and either gather more data and re-smooth or apply a manual progression to the ladder.
When there’s original data and no calculated data, why is the auto-smoothed data different from the original?
- Instead of treating each level separately, it looks at the entire progression holistically
- High R² means there are only minor tweaks, the model fits the data really well and is just ironing out bumps
- Taking averages was the old way to handle variance in market data, while simple it can create weird jumps between levels